
Health & healthcare in the Netherlands: Statistics, trends & facts (2026)
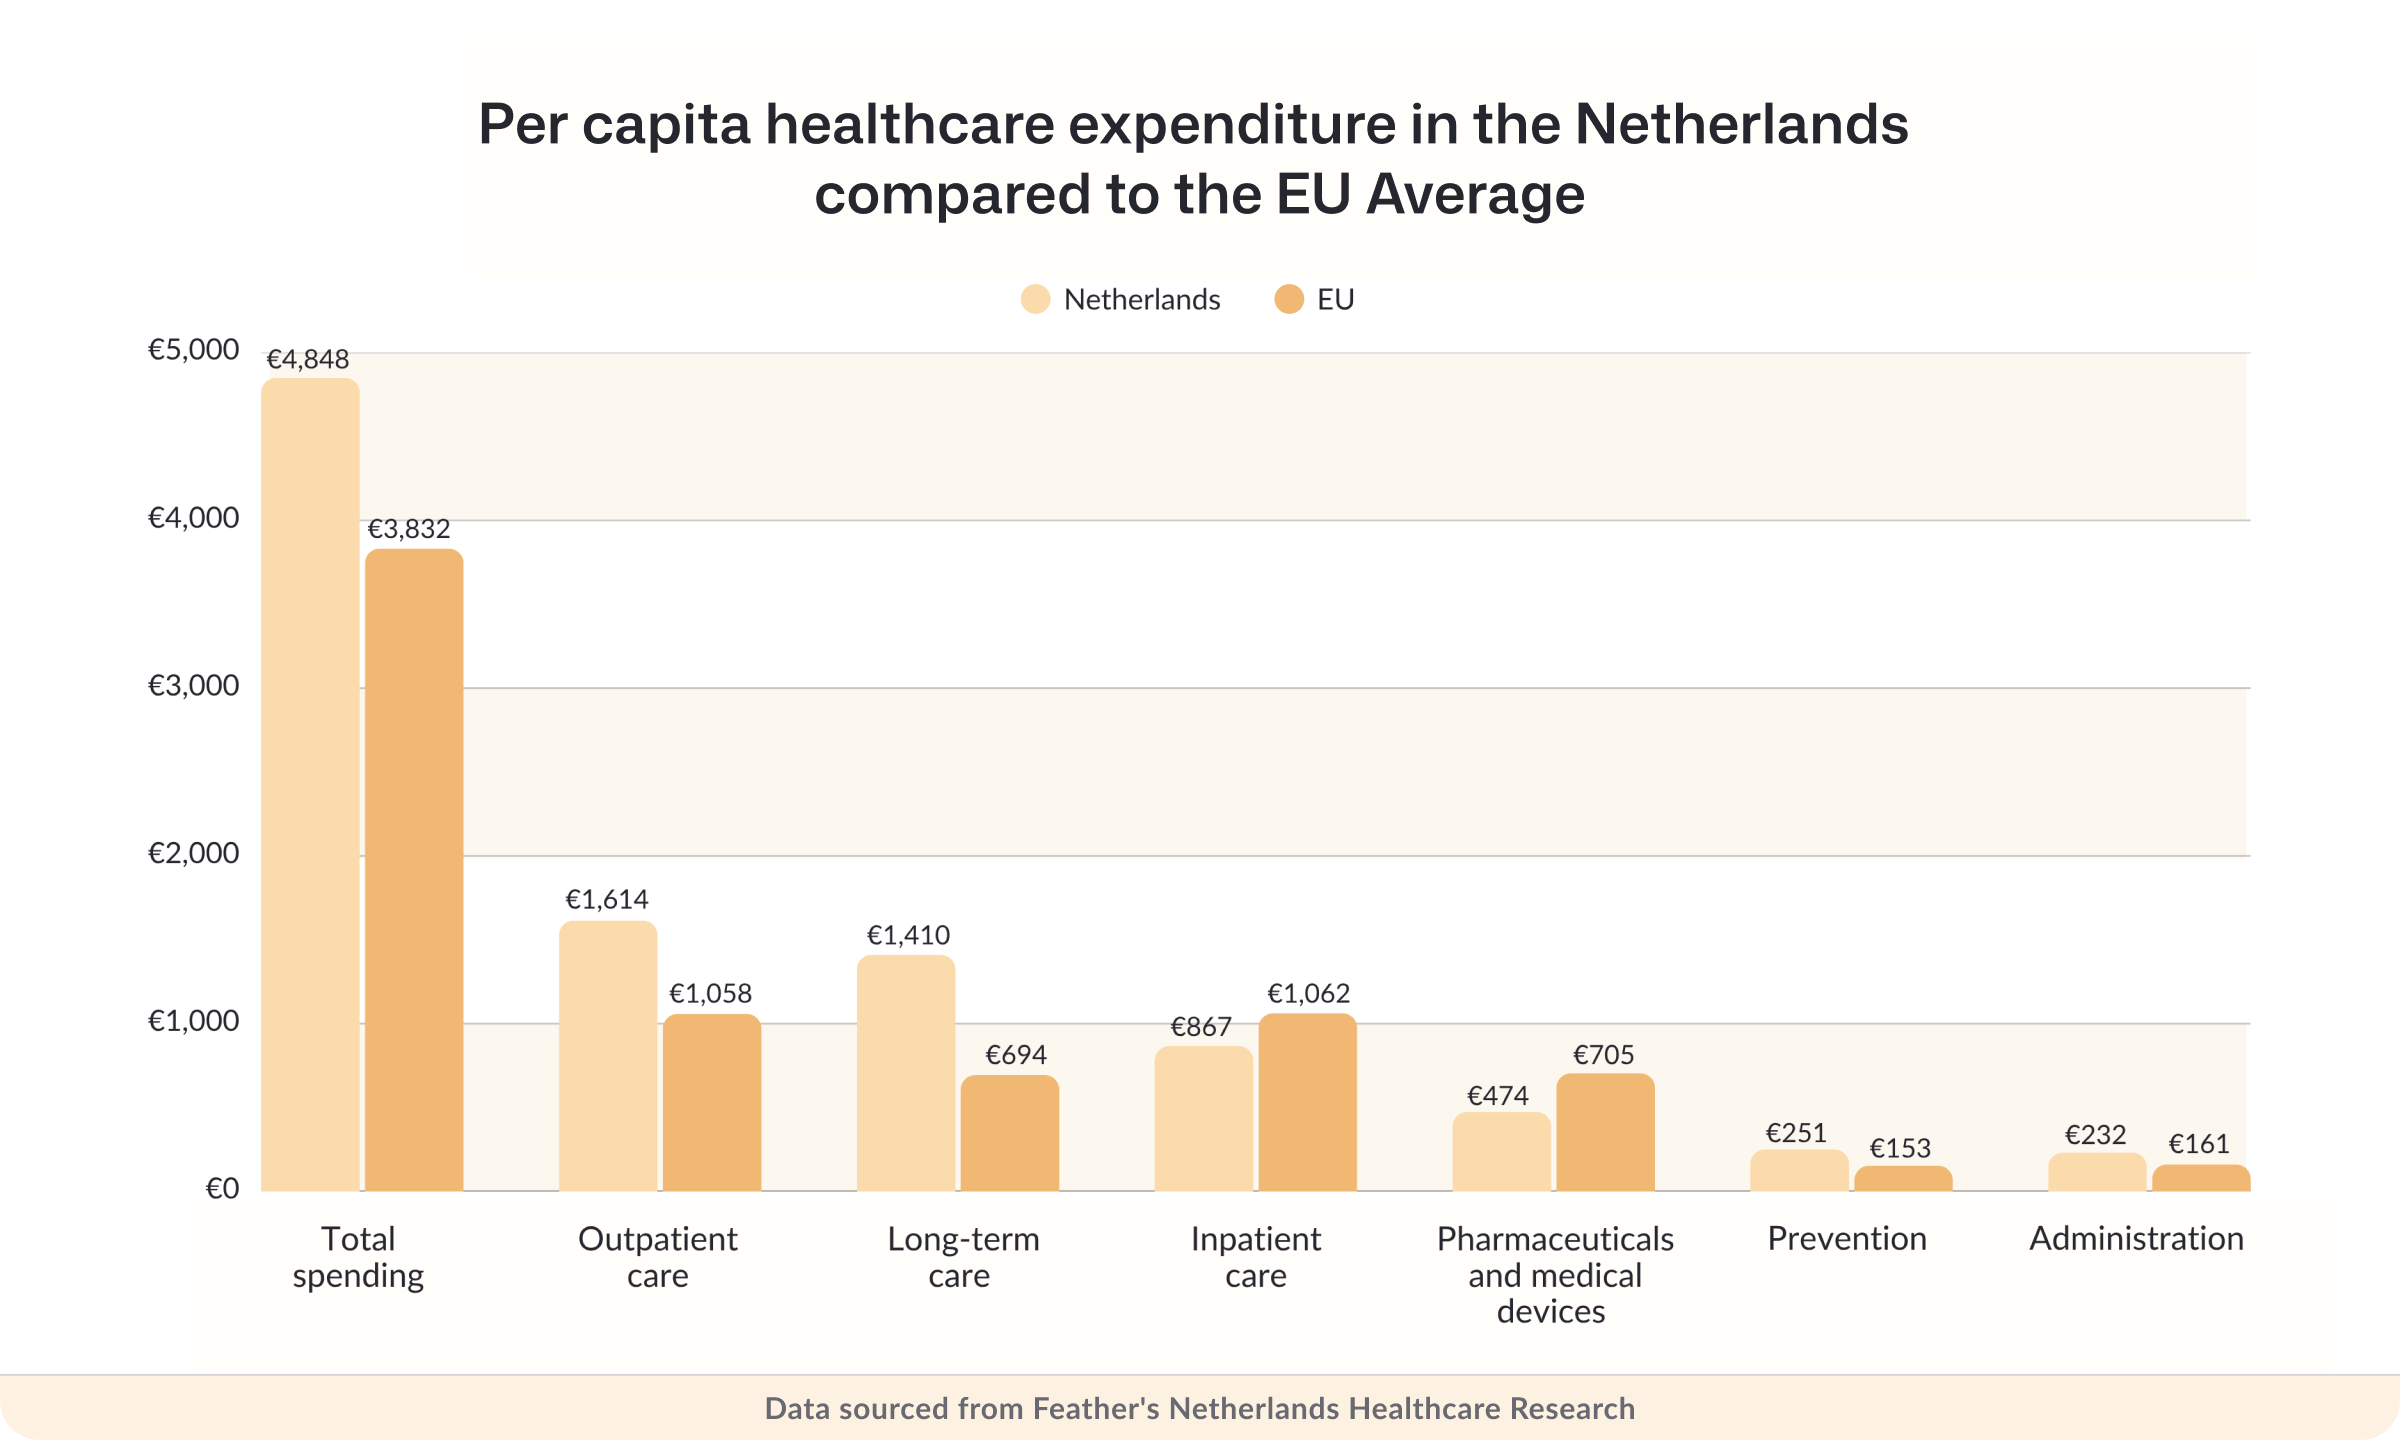
The Netherlands has one of the best-rated healthcare systems anywhere: 7th in the world, according to the latest ranking. It also spends more per person than almost any other country in Europe, at €4,848 a year.
If you live in the Netherlands (or you're planning to), that raises a fair question. Where does all that money actually go? And is it making people healthier?
In this article, we'll cover:
- How much the Netherlands spends on healthcare, and where the money comes from
- What the budget is spent on, from GP visits to long-term care
- How healthy Dutch residents are, and what they're most likely to die from
- How many doctors, nurses and hospital beds the country has
- How much sick leave Dutch workers take, and why it's rising
First, the headline numbers.
Key Dutch healthcare statistics: our top picks
- An estimated 25% of all sick days taken by Dutch workers are now put down to stress.
- In 2023, the average employee in the Netherlands took around 14 days of sick leave.
- 6% of people in the Netherlands rate their health as bad or very bad.
- About 9% of people in the Netherlands report unmet mental health needs.
- In 2023, generic medicines made up 79% of all pharmaceuticals dispensed through community pharmacies.
The Netherlands' population statistics
At the start of 2025, the Netherlands had 18,044,027 inhabitants. 49.8% (8,978,451) were men and 50.2% (9,065,576) were women. In other words, there are 99 men for every 100 women.
The population is getting older. The average age was 42.8 years in 2024, up from 33.2 years in 1975.
16.8% of residents (around 3 million people) were born abroad. The other 15 million were born in the Netherlands, and 2.1 million of them are children of migrants. In total, 11.7% of the population was born in the Netherlands to at least one parent born abroad.
The Netherlands is also highly urban. 93.45% of residents lived in an urban area in 2024, compared to 6.55% in a rural one.
Source: Statistics Netherlands, Trading Economics
How many young people are there in the Netherlands?
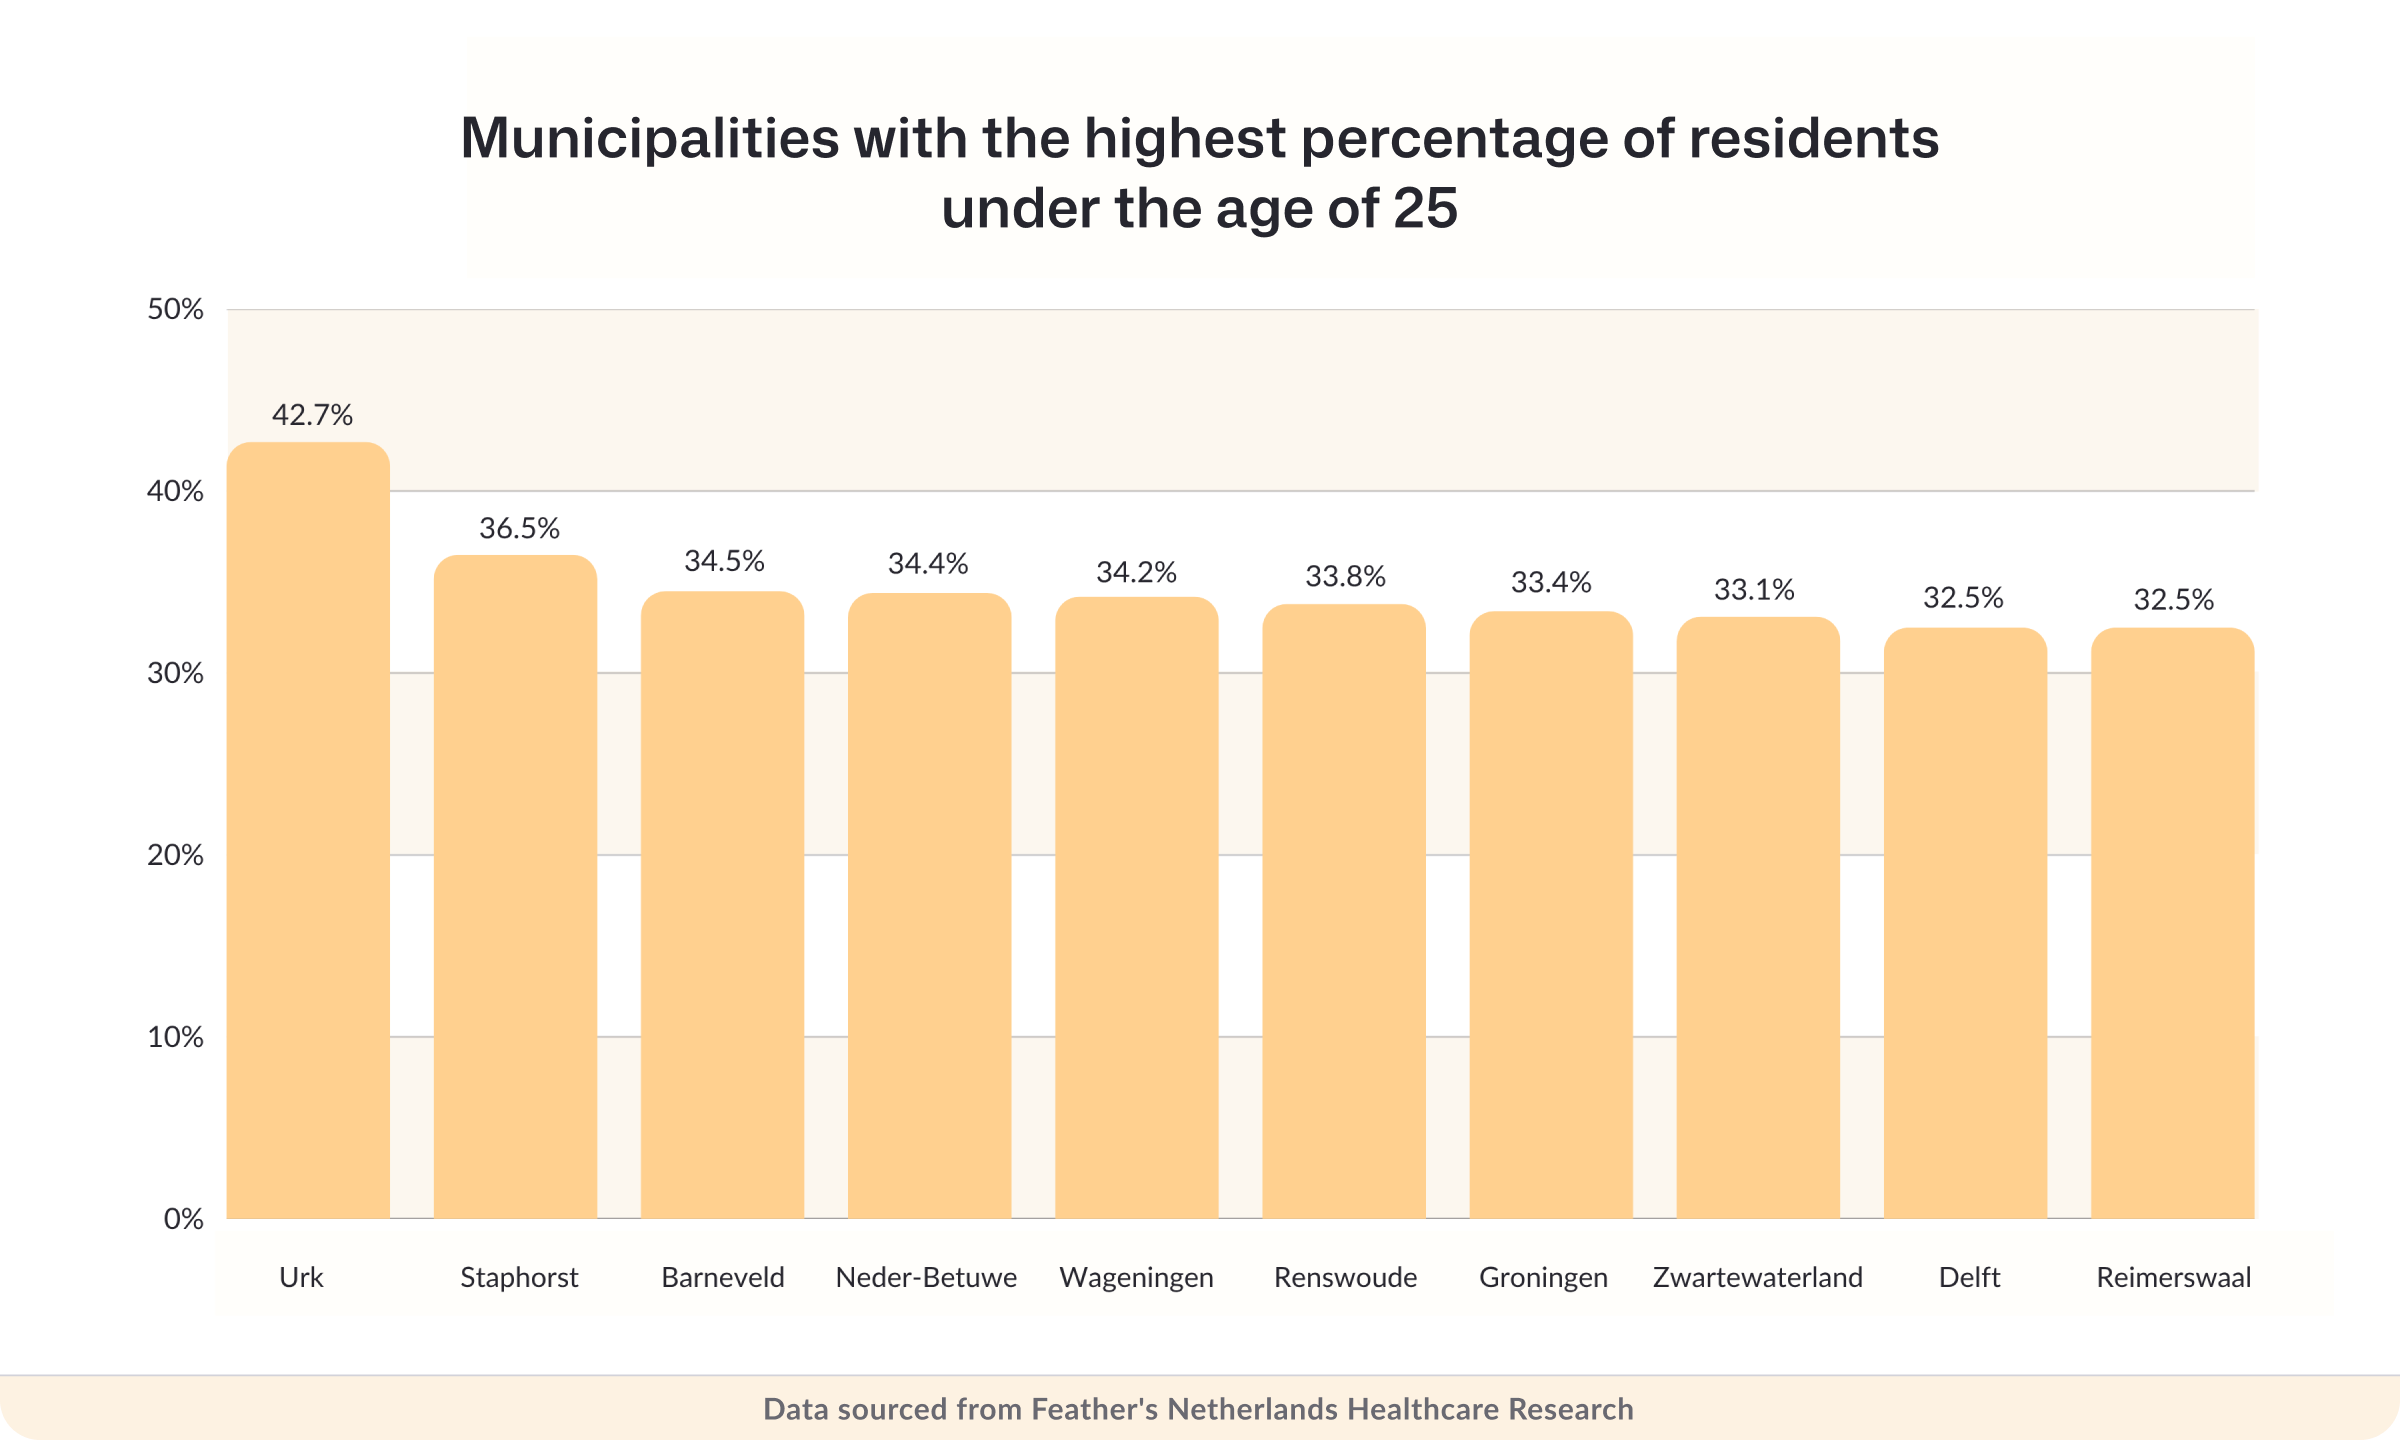
In 2025, 4,904,057 inhabitants (27.2% of the population) were under 25. They're not spread evenly across the country, though.
Urk had the highest share of under-25s at 42.7%, followed by Staphorst (36.5%) and Barneveld (34.5%).
The graph below shows the 10 Dutch municipalities with the highest share of young people.
Source: Statistics Netherlands
Life expectancy statistics in the Netherlands
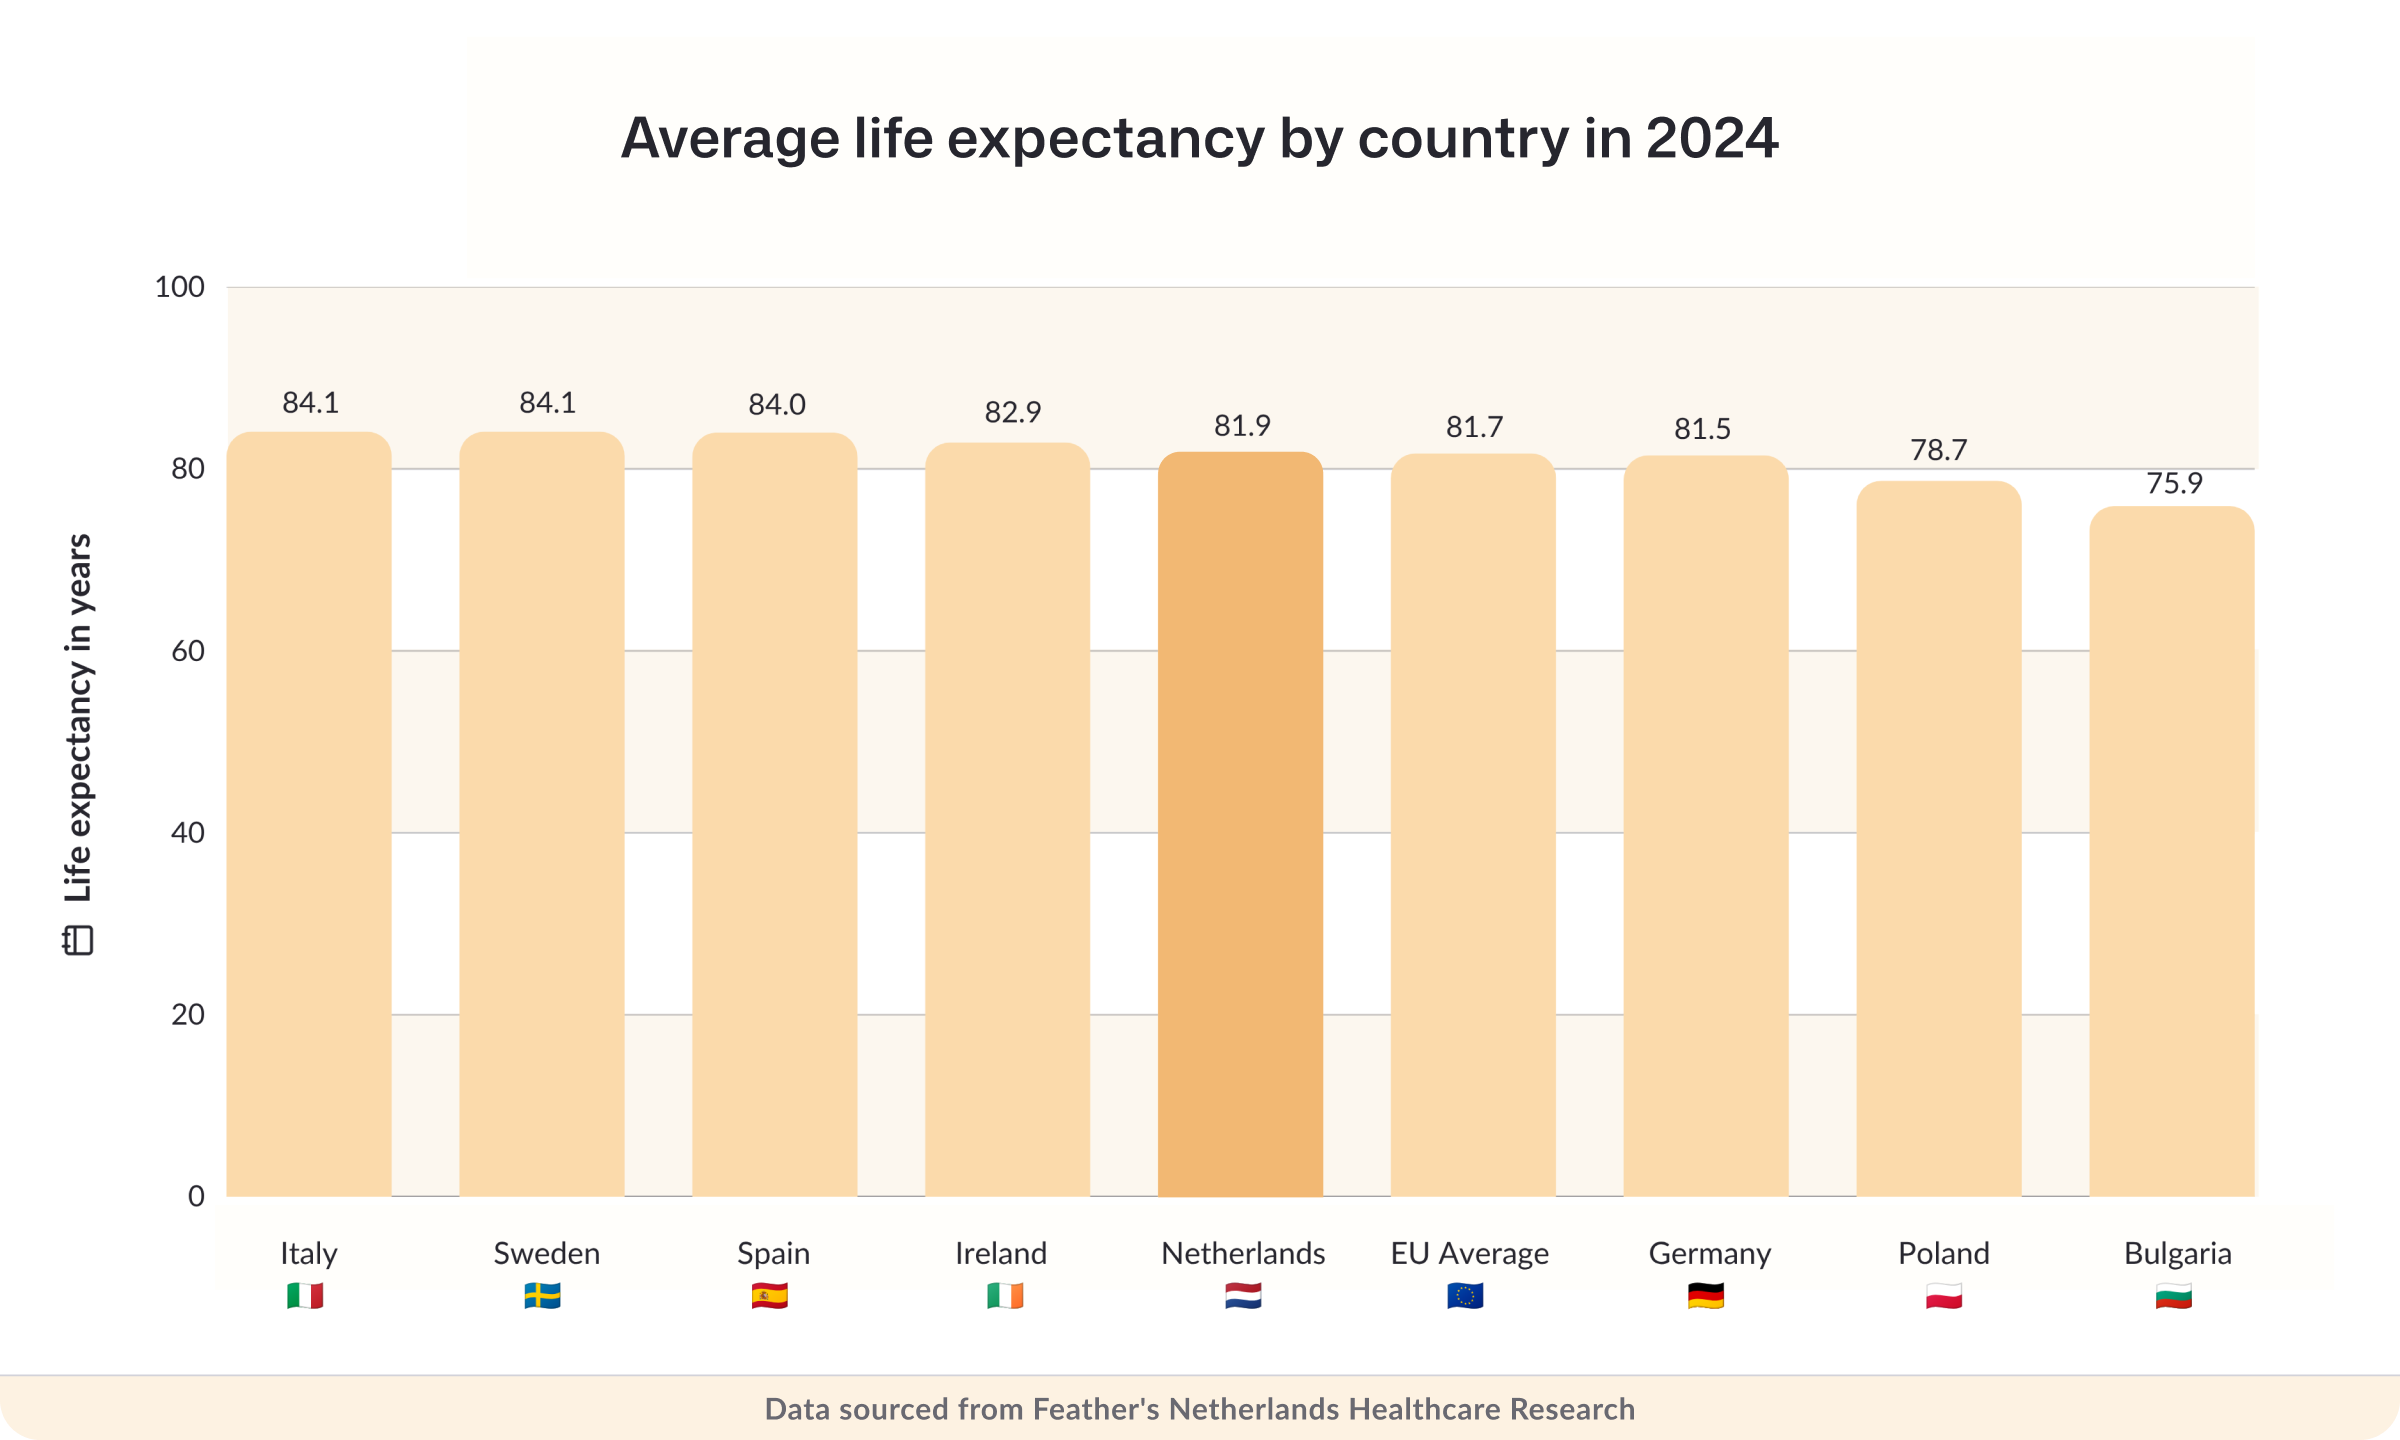
In 2024, average life expectancy in the Netherlands was 81.9 years, 0.8 years above the OECD average. Men could expect to live to 80.5, and women to 83.3.
That's a long way from 1950, when average life expectancy was 71.5 years (70.3 for men and 72.6 for women).
Today, Dutch life expectancy sits below Italy, Sweden and Spain, but above Germany and the EU average.
Source: Statistics Netherlands, OECD, European Health Observatory
How much does the Netherlands spend on healthcare?
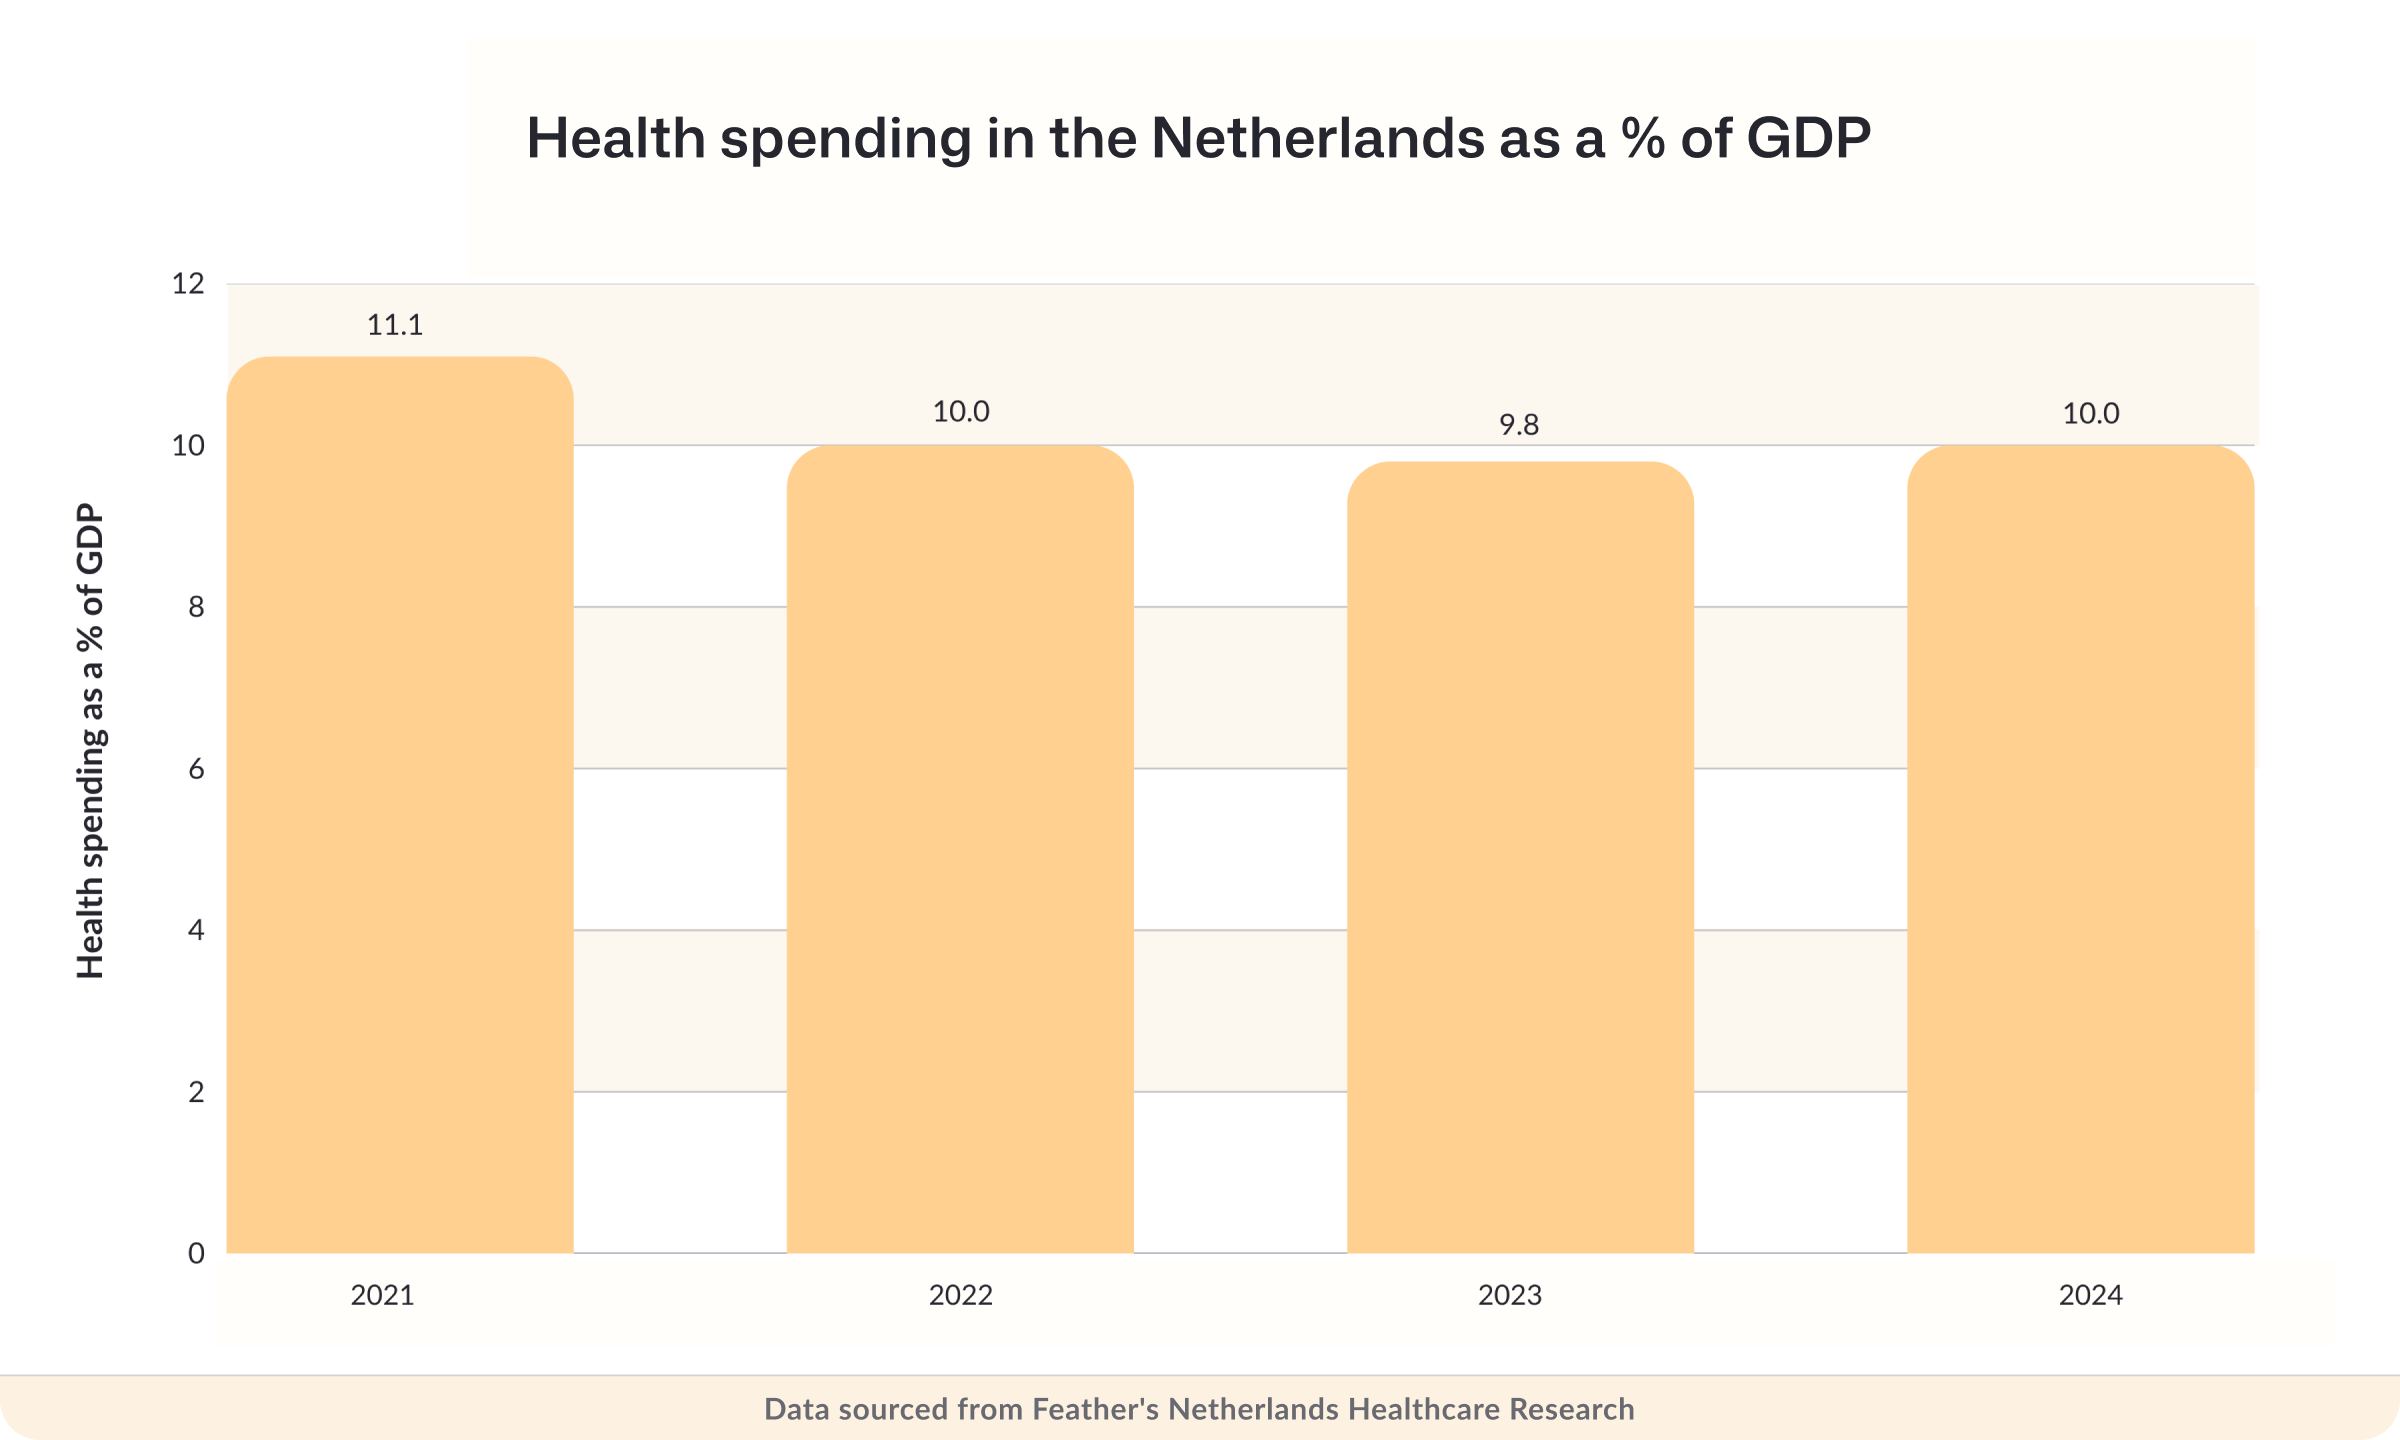
In 2023, the Netherlands spent 9.8% of its GDP on healthcare, just under the EU average of 10%. Per person, though, it spent far more: €4,848, around 25% above the EU average.
By 2024, total healthcare spending had climbed to €113.5 billion. That's an €8.5 billion (8.1%) increase on the year before. Healthcare grew faster than the economy as a whole, pushing spending up to 10% of GDP and bringing the Netherlands in line with the EU average.
Here's how spending per person in the Netherlands compares to the EU average:
-
Outpatient care:
€1,614 per person in the Netherlands vs €1,058 EU average -
Long-term care:
€1,410 per person, more than double the EU average of €694 -
Inpatient care:
€867 per person, lower than the EU average of €1,062 -
Pharmaceuticals and medical devices:
€474 per person vs €705 across the EU
Who pays for it? 83% of healthcare spending is funded by the government and mandatory insurance. 12% comes from out-of-pocket payments, and the remaining 5% from voluntary health insurance.
Source: European Health Observatory, Statistics Netherlands
Where does the Netherlands spend its healthcare budget?
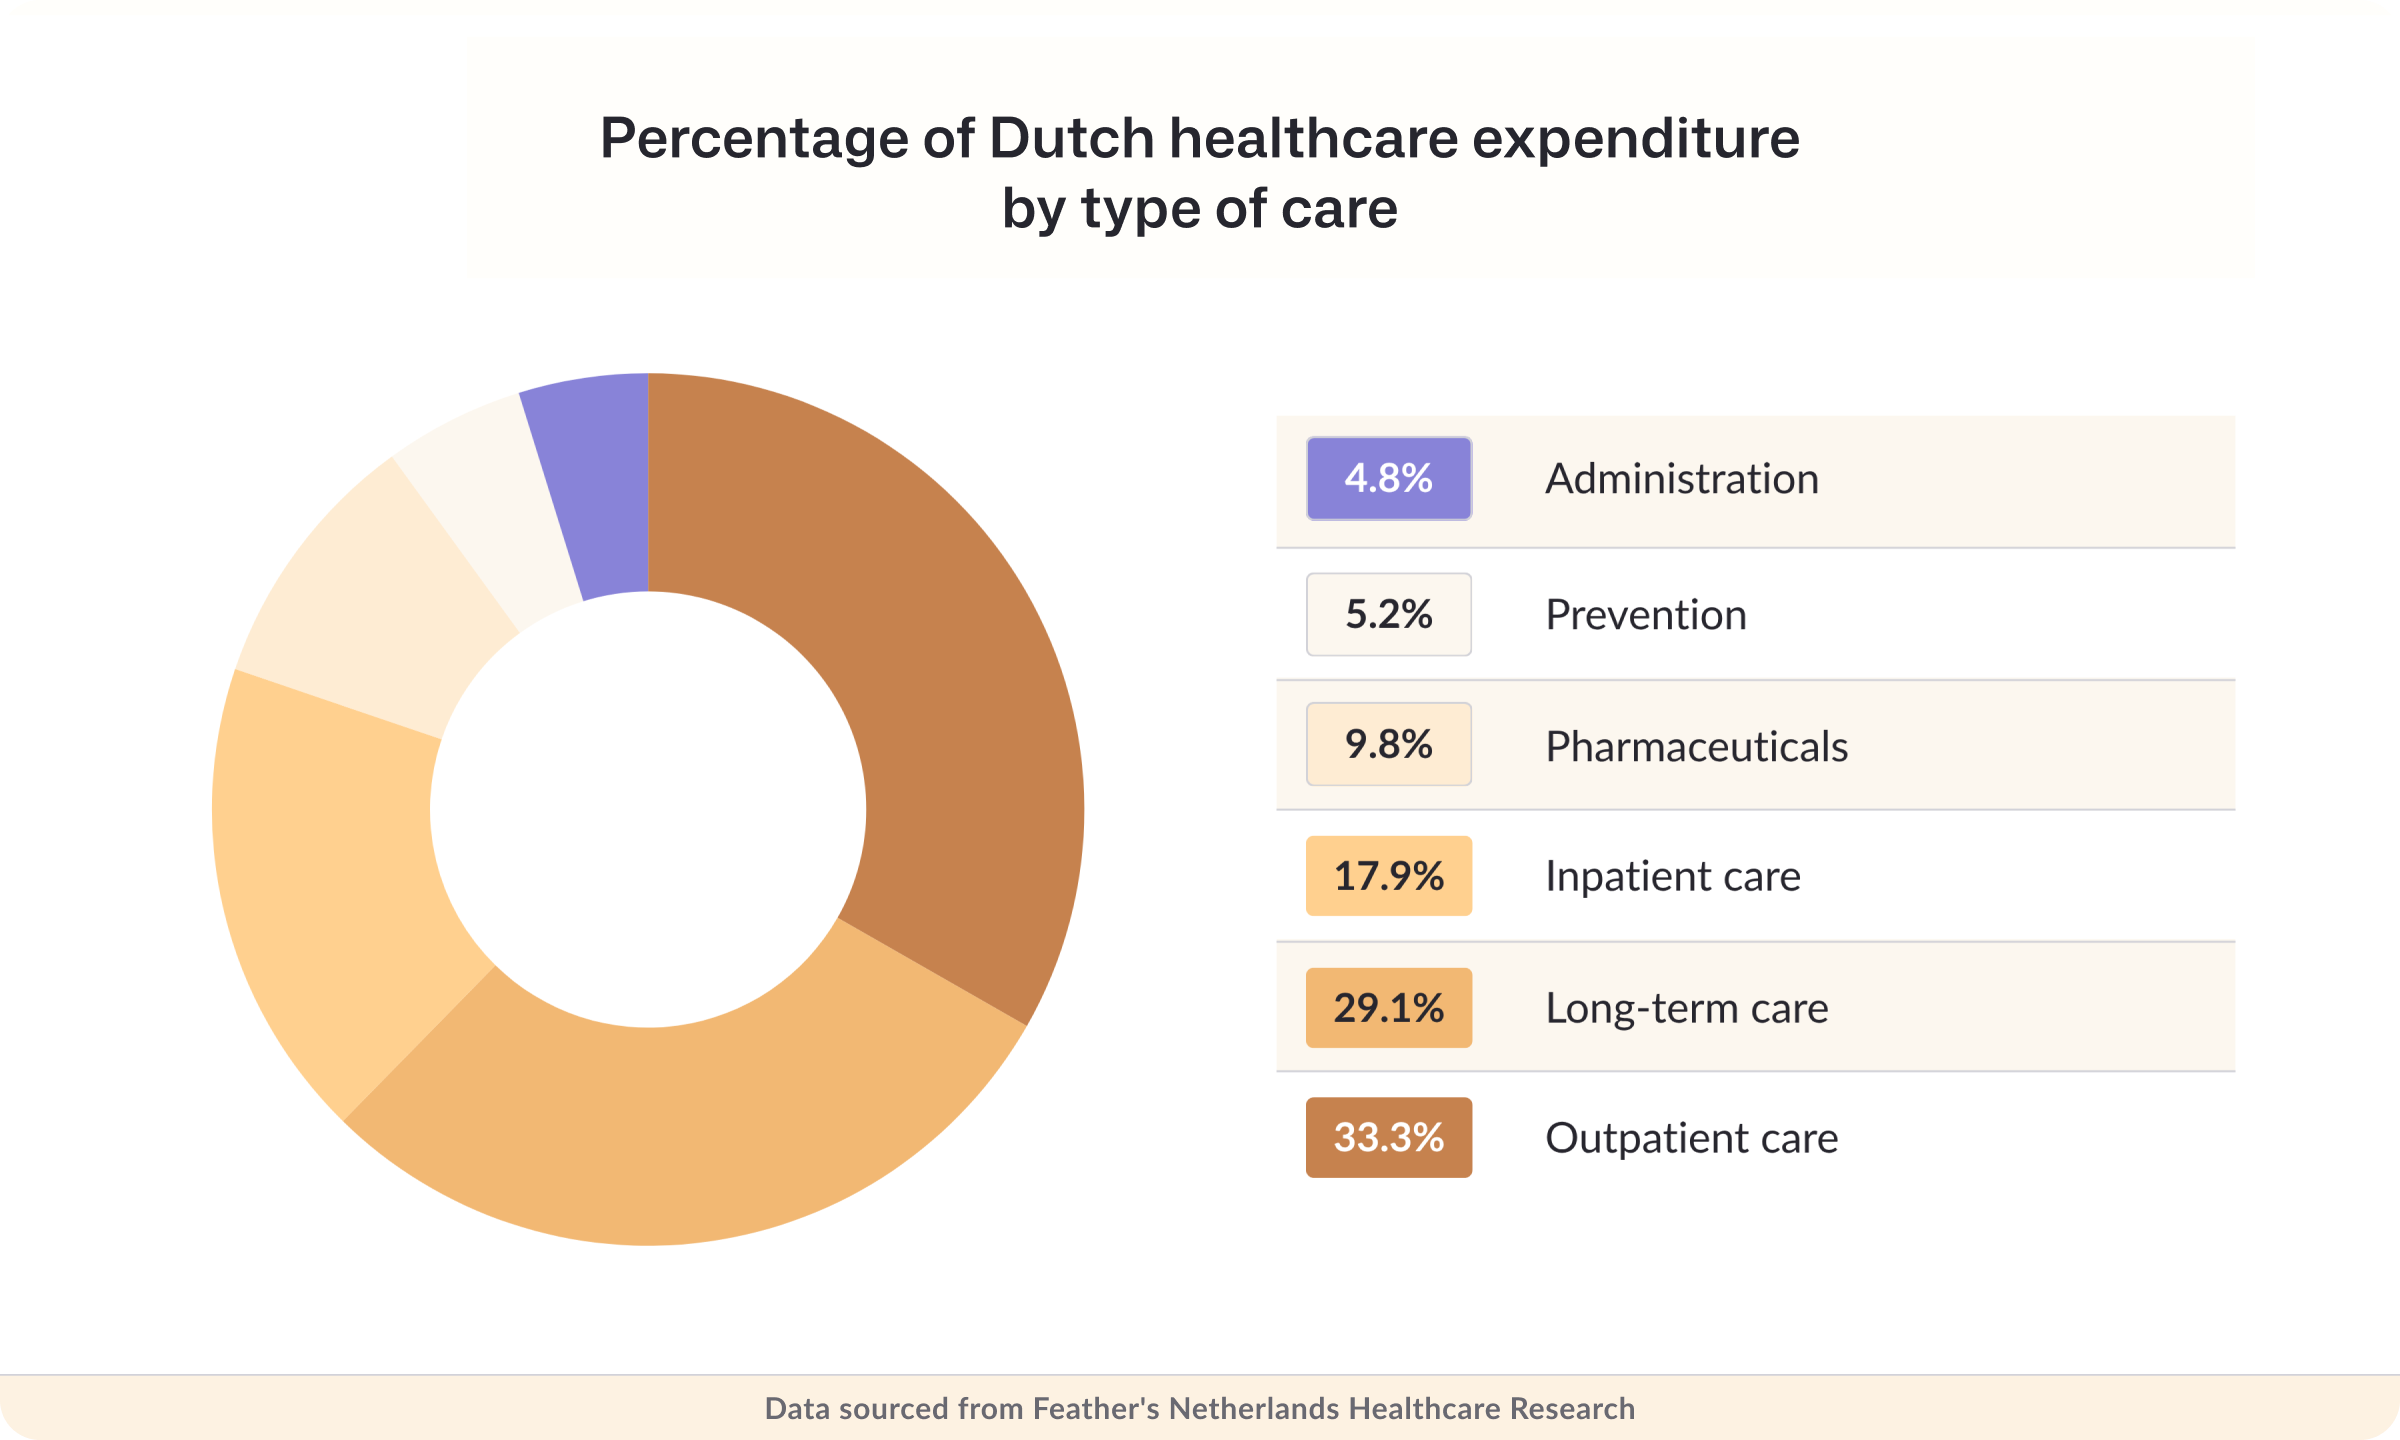
The biggest slice goes to outpatient care, at roughly 33.3% of healthcare spending.
Long-term care comes next at 29%, well above the EU average of 18%. Inpatient care takes 18%, and pharmaceuticals 10%.
Spending on prevention jumped during the COVID-19 pandemic, from 3.3% of total health spending in 2019 to 8.7% in 2021. It fell back to 5.2% in 2023, but that's still above the EU average of 4.2%.
The pattern is clear: the Dutch system puts outpatient and long-term care ahead of hospital stays and medicines.
Source: European Health Observatory
How much does the Netherlands spend on pharmaceuticals?
Not much, by EU standards. That's true both in total and as a share of healthcare spending.
In 2023, retail pharmaceutical spending came to €6.7 billion, or €309 per person. That's the lowest in the EU: nearly half the EU average, and less than 15% of total healthcare spending.
Source: European Health Observatory
How are pharmaceuticals funded in the Netherlands?
Mostly through social health insurance, which covered 68% of retail pharmaceutical spending. That's above the EU average of 62%, but below France (83%), Germany (83%) and Belgium (74%).
Patients paid 31% of retail pharmaceutical costs out of pocket in 2023. That's below the EU average of 36%, but noticeably higher than France and Germany, where out-of-pocket payments made up 12% and 17% respectively.
The Netherlands is also one of the EU's biggest users of generic medicines. In 2023, generics made up 79% of all pharmaceutical units dispensed through community pharmacies, up from 67% in 2012.
Source: European Health Observatory
Where does healthcare funding in the Netherlands come from?
Coverage in the Netherlands is close to universal. 99.9% of the population is covered by statutory health insurance, which pays for most types of care:
-
94% of inpatient care costs were publicly financed in 2023, above the EU average of 91%
-
79% of outpatient care spending was publicly funded, slightly above the EU average of 77%
-
68% of pharmaceutical spending was publicly financed, compared to 59% across the EU
Dental care is the big exception. Only 33% of dental costs were publicly financed in 2023, slightly below the EU average of 35%. So if you need dental work in the Netherlands, expect to pay more of it yourself.
Source: European Health Observatory
How healthy are people in the Netherlands?
Healthier than the EU average on most counts. 13.2% of Dutch adults smoke daily, and they drink an average of 7.8 liters of alcohol per person a year. The EU averages are 18.5% and 9.8 liters.
13.6% of Dutch adults are obese, just below the EU average of 14.6%. Education makes a big difference here: people with the lowest education level are more than twice as likely to smoke and be obese as the most highly educated.
6% of people in the Netherlands rate their health as bad or very bad, a little below the OECD average of 8.0%.
Source: Statistics Netherlands, OECD, European Health Observatory
How many people in the Netherlands have a chronic health condition?
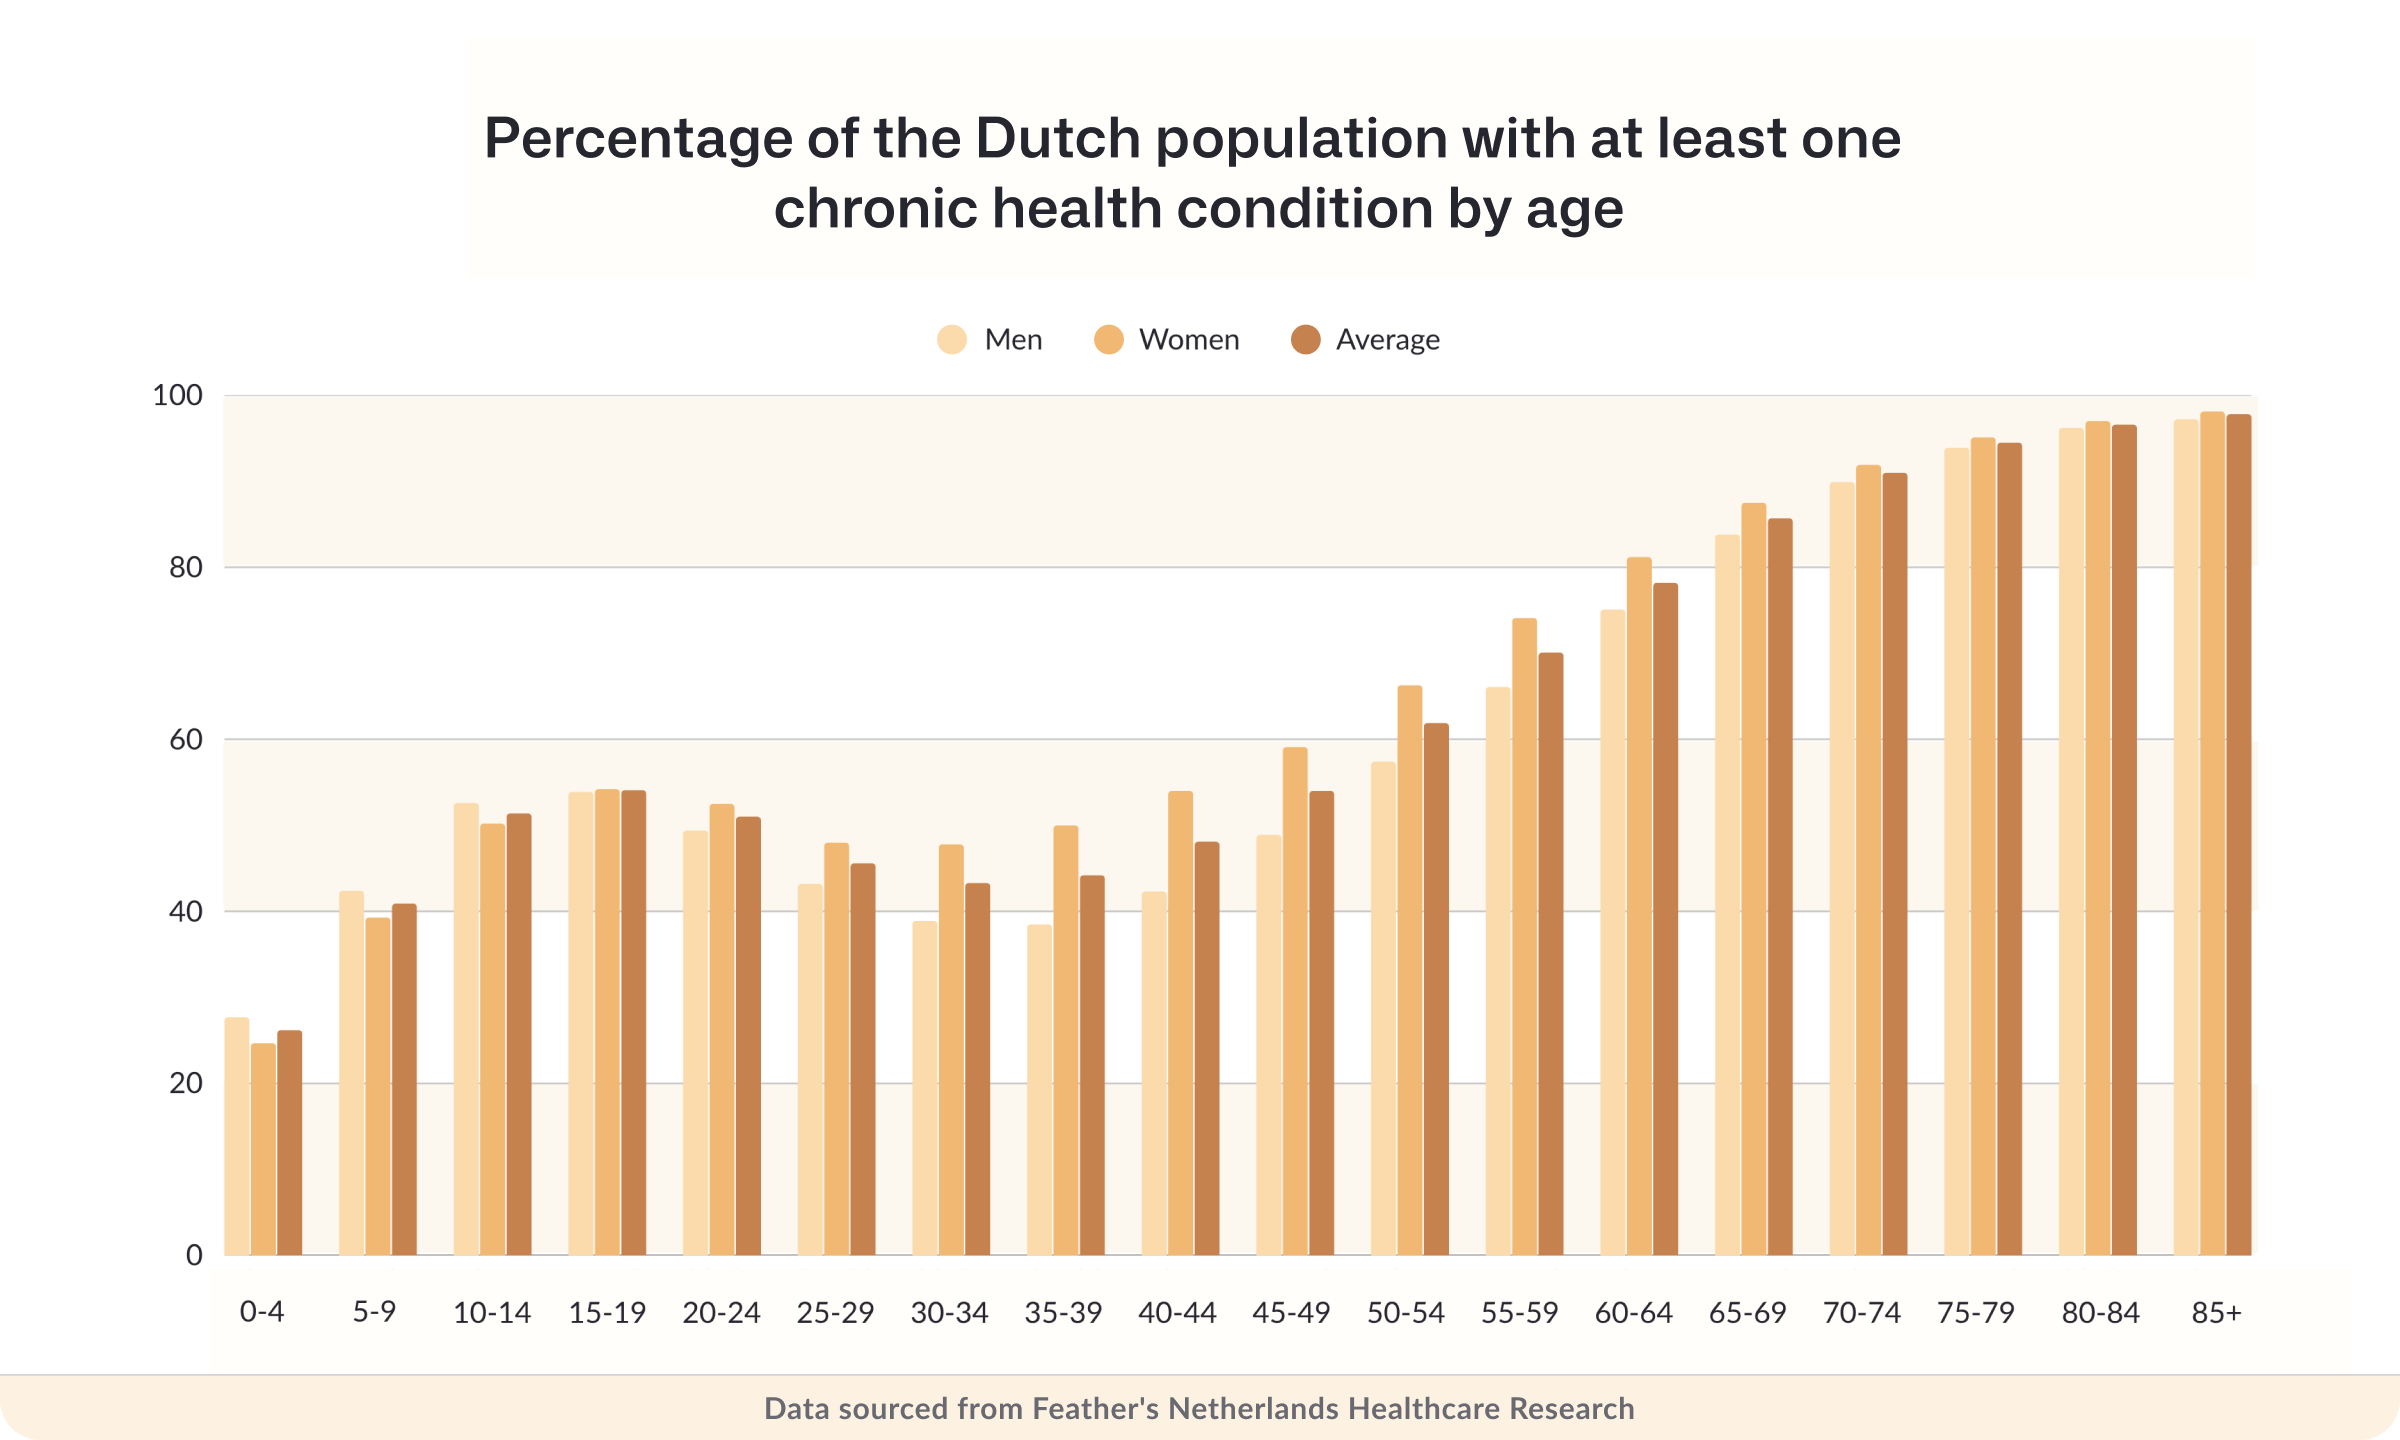
Around 58% of the population, or 10.5 million people, had at least one chronic disease in 2022. By 2025, that had risen to 10.9 million people.
In 2024, 5.6 million people (31% of the Dutch population) saw their GP at least once about a chronic condition.
Age is the biggest factor. 96% of Dutch residents over 75 have a chronic condition, compared to 45% of those under 40.
Source: Statistics Netherlands, OECD, VZ Info
Cause of death statistics in the Netherlands
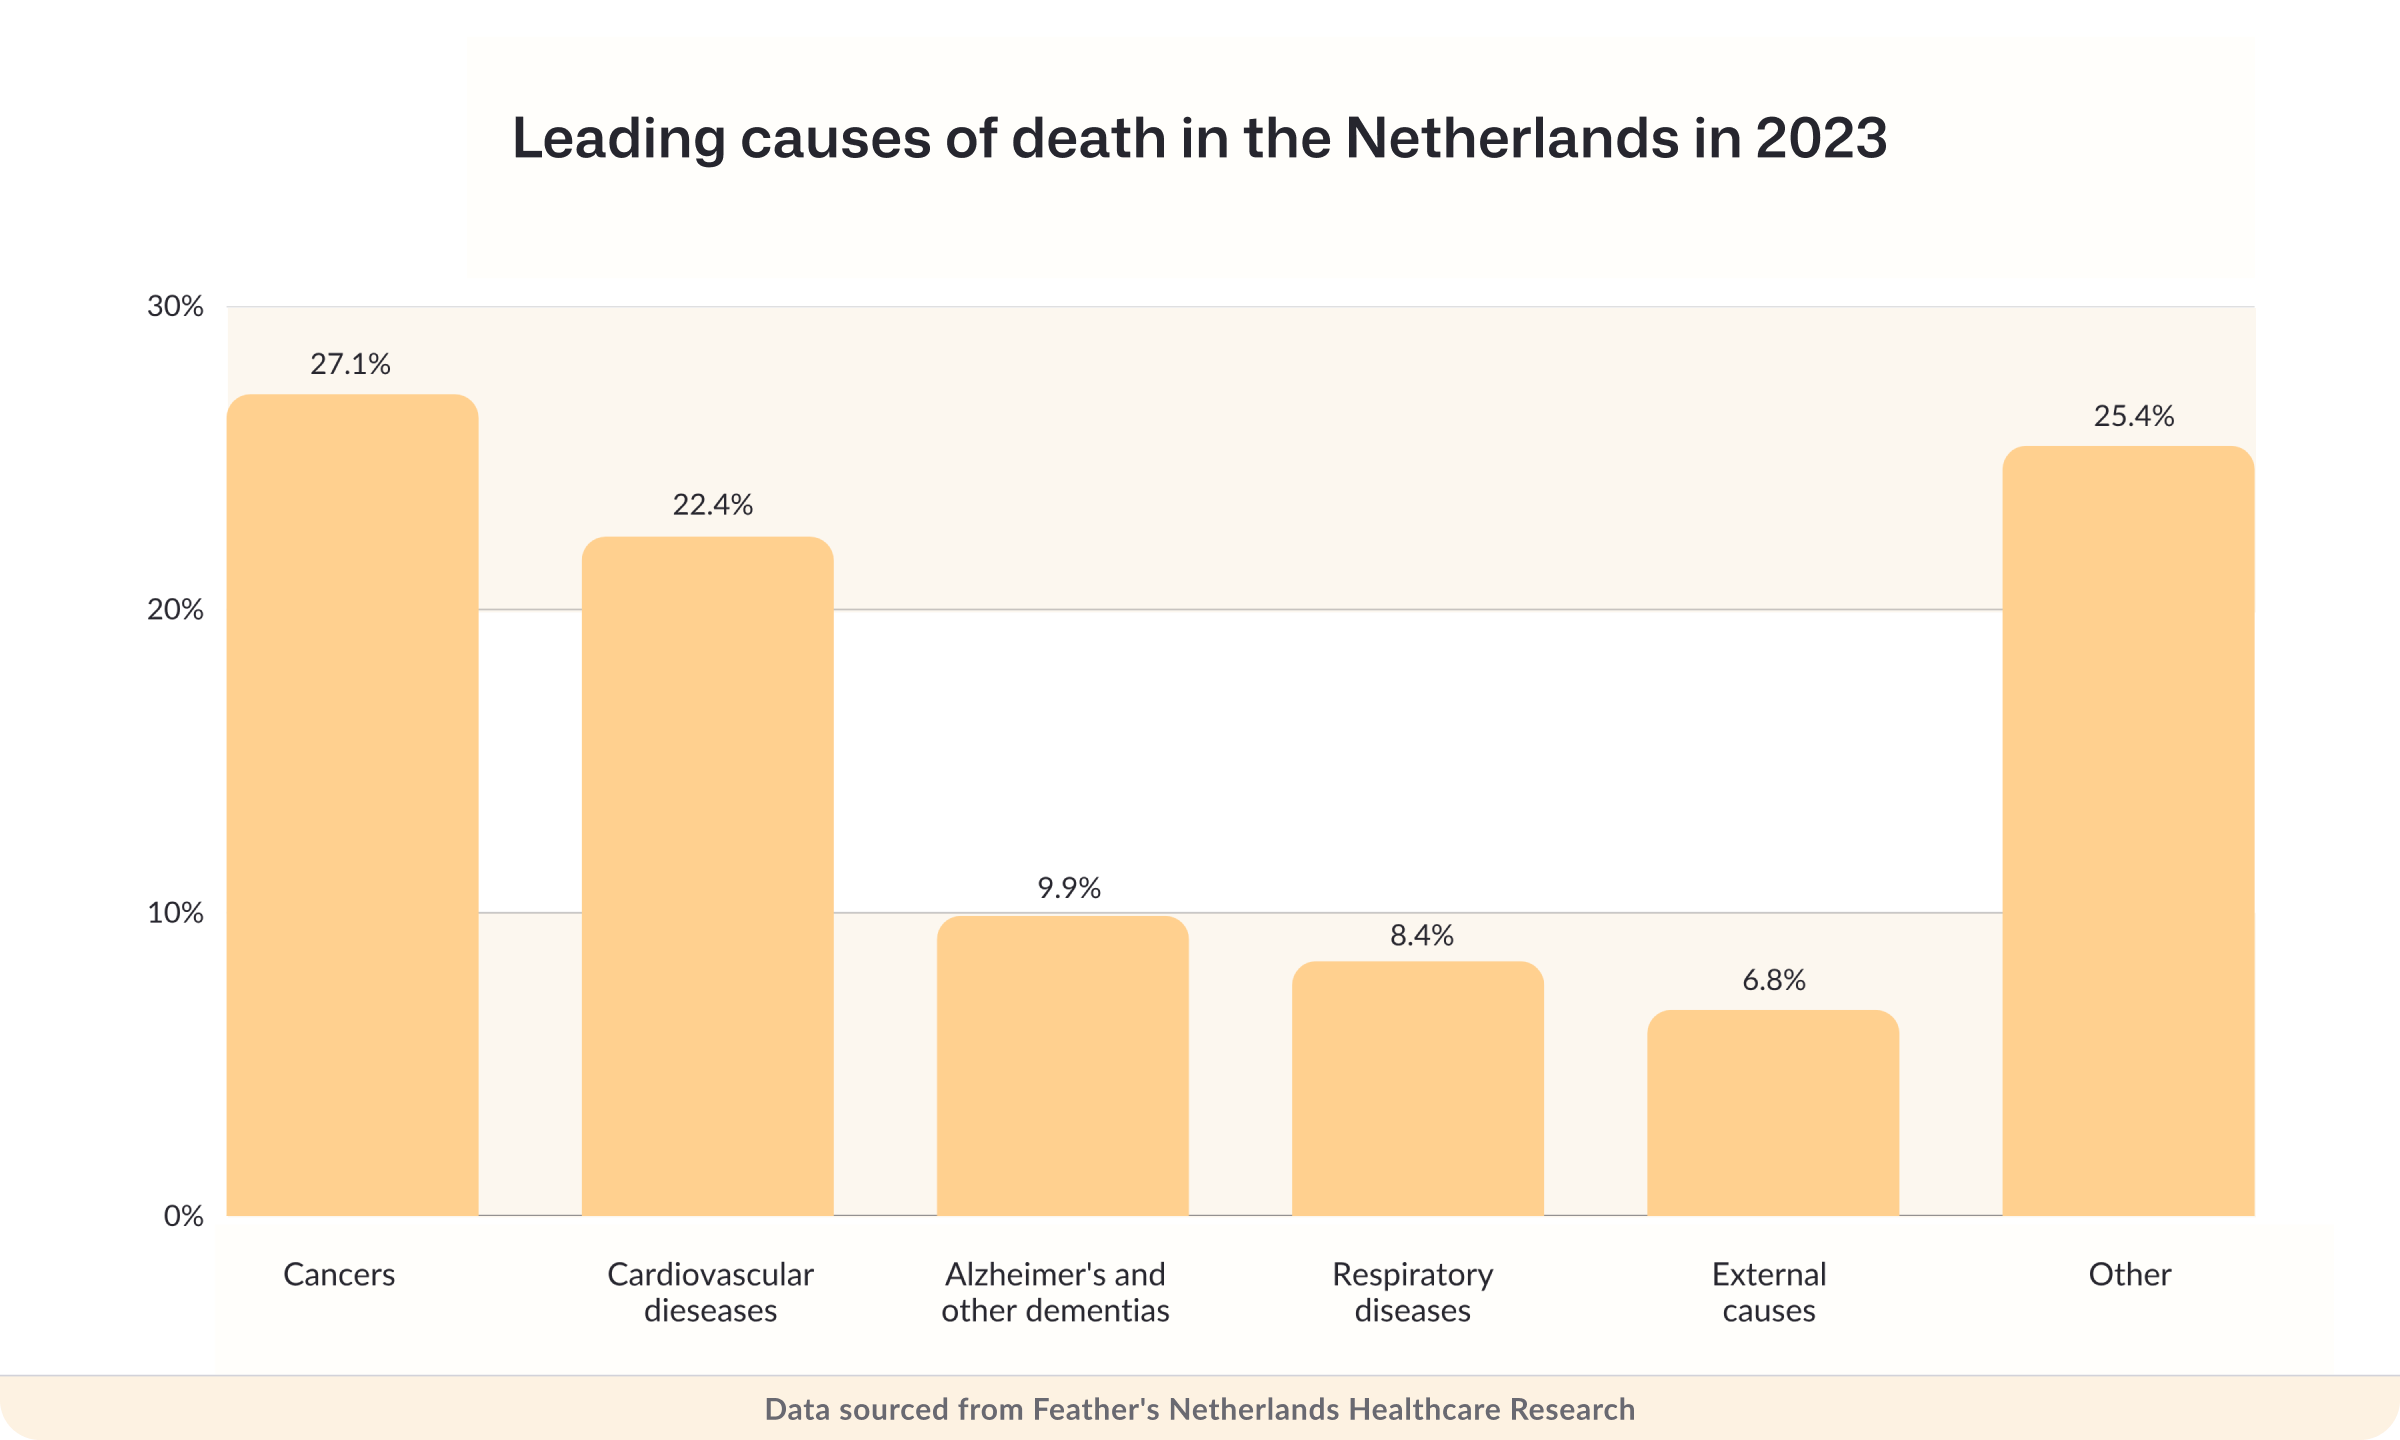
In 2023, 168,764 deaths were recorded in the Netherlands. Cancer (malignant neoplasms) was the single largest cause, responsible for 27.1% of deaths. Cardiovascular diseases came second at 22.4%.
Alzheimer's and other dementias were the third leading cause, at 9.9% of deaths.
Falls accounted for 3.7% of deaths and suicide for 1.2%. Only 0.5% of deaths were due to transport accidents.
Source: European Health Observatory
How many doctors and nurses are there in the Netherlands?
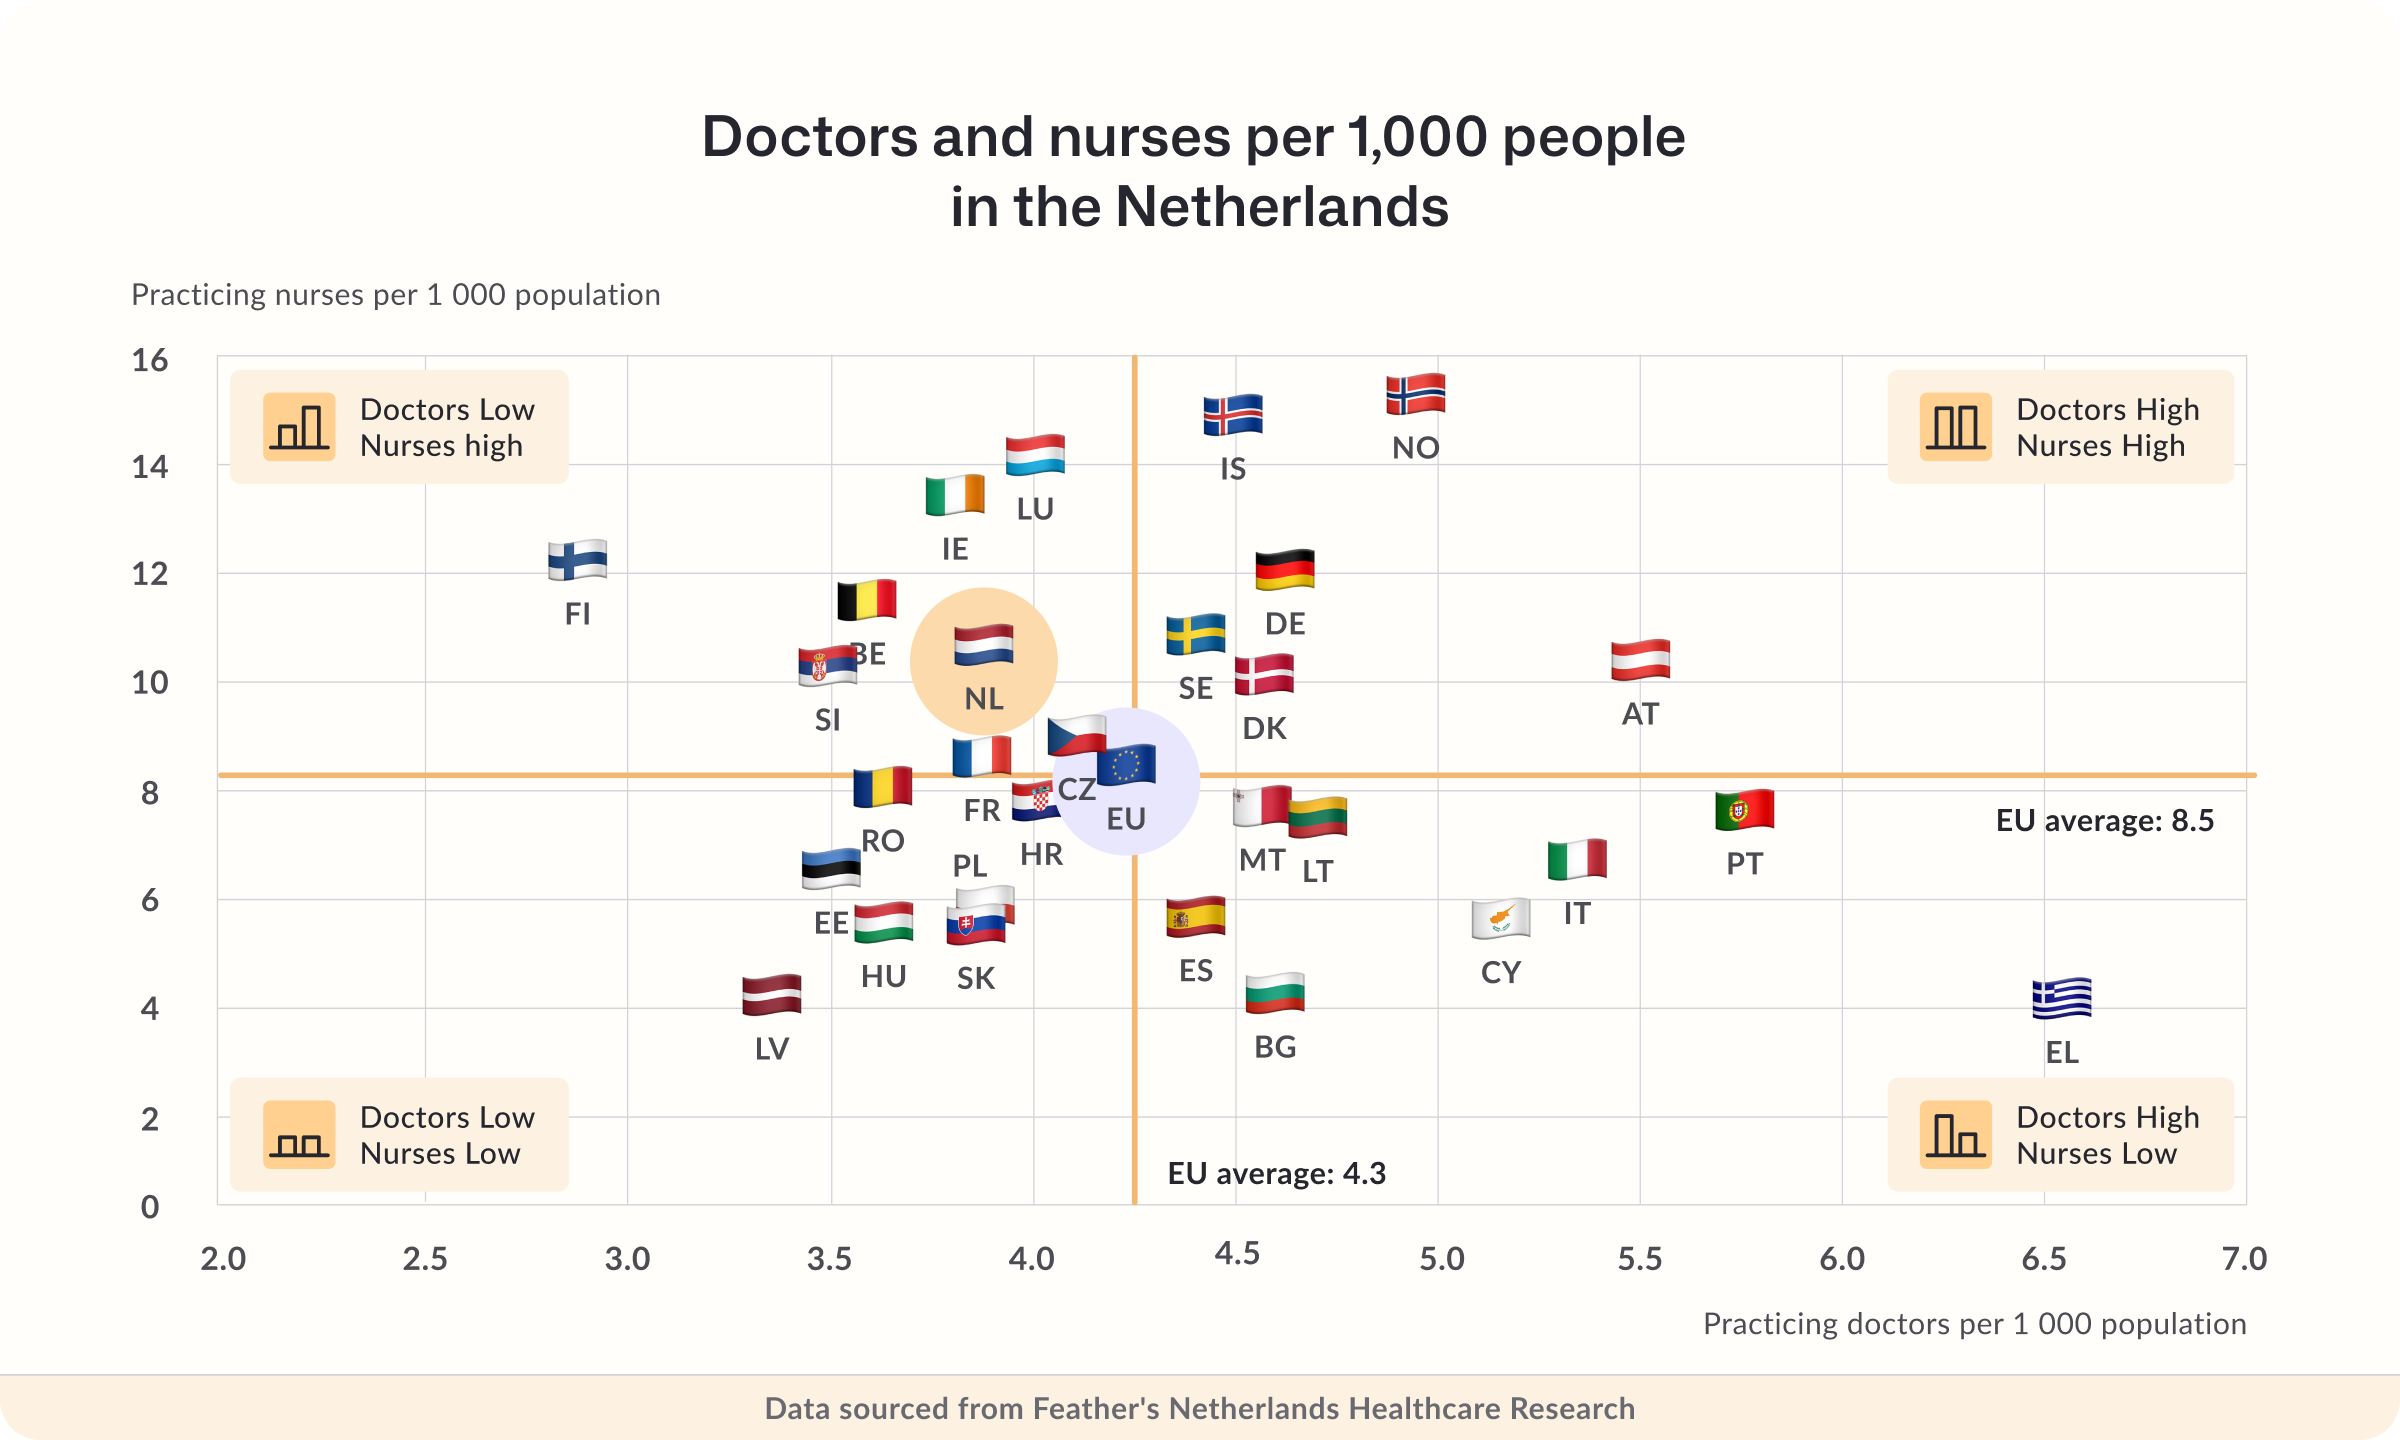
In 2023, the Netherlands had 3.9 practicing doctors per 1,000 people, up from 3.4 per 1,000 in 2014. Even so, it's still below the EU average of 4.3 doctors per 1,000 people.
One thing that stands out is the focus on primary care. Around one in four doctors in the Netherlands works as a general practitioner (GP).
Nurses are a different story. Numbers have grown steadily, from 10.3 nurses per 1,000 people in 2014 to 11.1 per 1,000 in 2023. That's well above the EU average of 8.4 nurses per 1,000 people.
Overall, the Netherlands has more nurses per person than France, but fewer doctors and nurses than Luxembourg, Germany, Iceland and Norway.
Source: European Health Observatory
What percentage of the population has unmet medical needs?
Very few people in the Netherlands go without the care they need. But the picture changes when you look at income and the type of care.
In 2024, 1.6% of the population reported an unmet medical need because of cost, distance or waiting times. That's less than half the EU average of 3.5%.
Among people below or at risk of poverty, 4.3% reported unmet medical needs. Unmet dental care needs affected 2.6% of the population, rising to 6% among lower-income households.
The biggest gap is in mental healthcare. About 9% of people in the Netherlands reported unmet mental health needs, above the EU average of 7%, despite strong coverage overall.
Source: European Health Observatory
How many hospital beds are there in the Netherlands?
The Netherlands has one of the lowest levels of hospital capacity in the EU. That's by design: the system has long focused on outpatient and primary care instead.
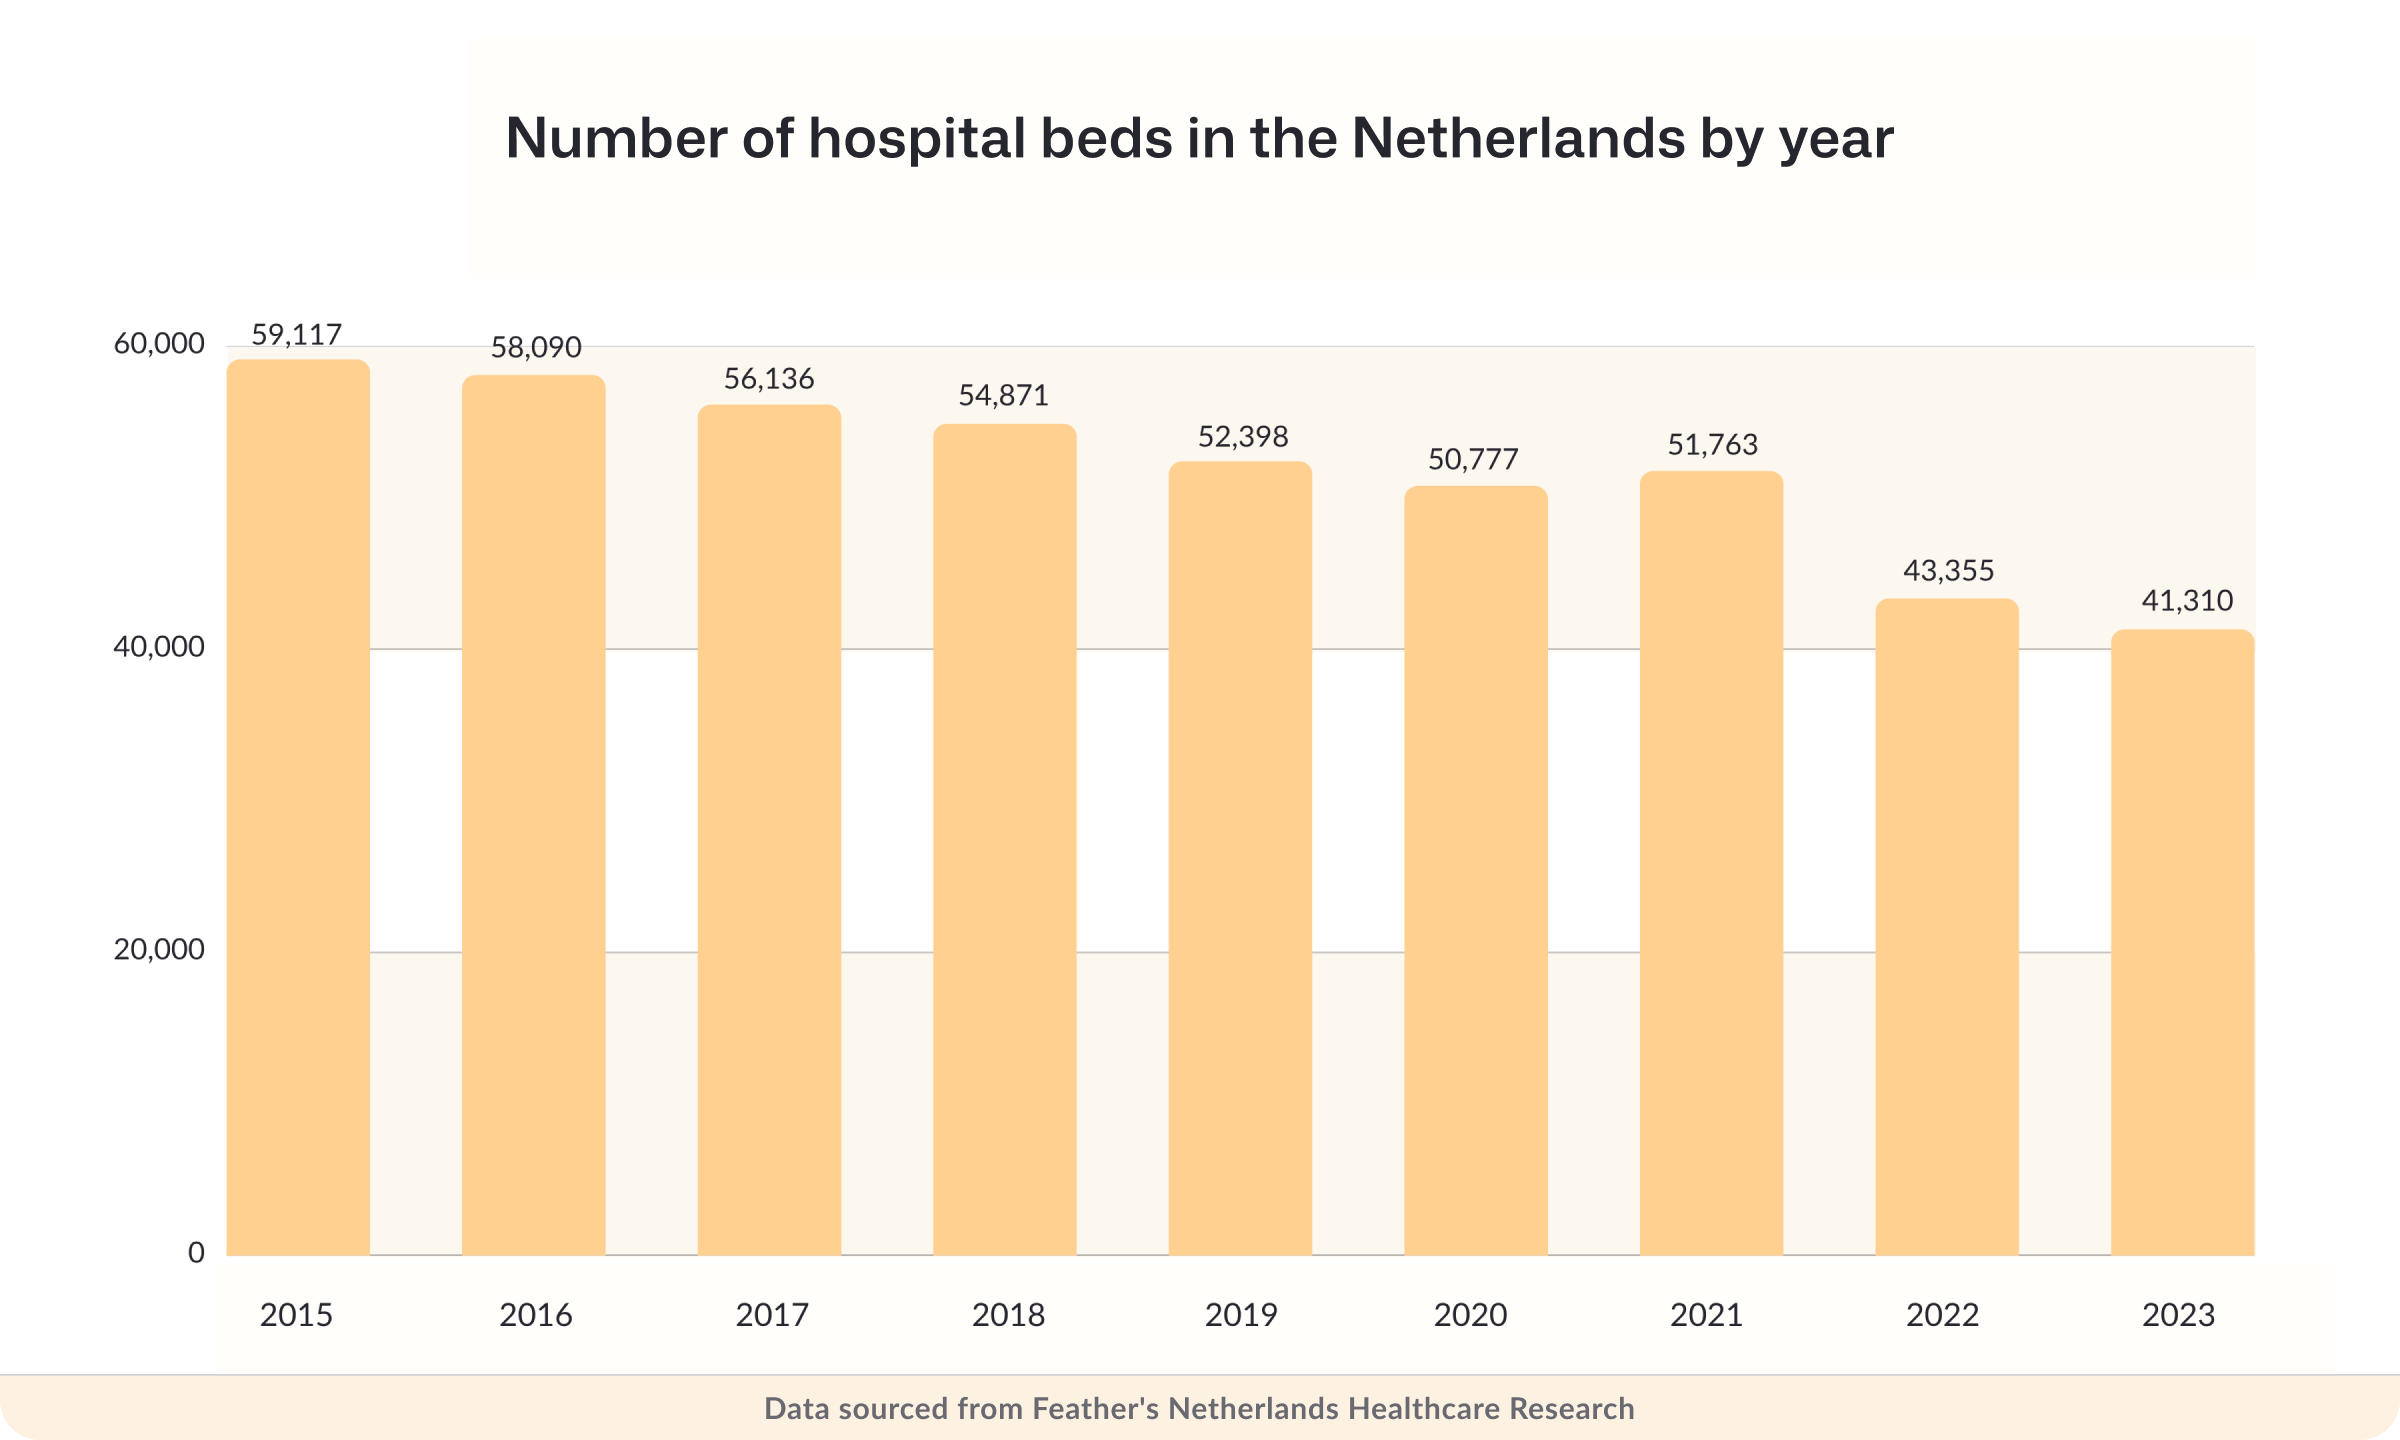
Hospital beds fell from 3.2 per 1,000 people in 2017 to 2.3 per 1,000 in 2023. That's less than half the EU average of 5.1 beds per 1,000 people.
In 2023, the Netherlands had 41,310 hospital beds, down from 43,355 in 2022. The longer trend is even clearer: in 2015, the country had 59,117 hospital beds.
Fewer beds fits the Dutch model, which favors outpatient care, shorter hospital stays and treatment outside traditional hospital settings.
Hospitals are also used less. The country had around 8,000 hospital discharges per 100,000 people in 2023, half the EU average. Bed occupancy stood at 60%, below the EU average of 68%.
Source: European Health Observatory, EuroStat
How many hospitals are there in the Netherlands?
In 2022, the Netherlands had 733 hospitals, up from 691 in 2021. That continues a long-term rise from 198 hospitals in 2005. (Fewer beds, but more places to get care.)
Source: Statista
How many people are employed in the Dutch health and welfare sector?
In 2023, an estimated 1.63 million people worked in Dutch health and welfare, up from 1.6 million in 2022. Go back to 2001 and the figure was 1.05 million.
That means around 580,000 extra people joined the sector between 2001 and 2023.
Not every group is growing, though. The number of self-employed healthcare workers has dropped over the last few quarters.
In the five quarters since Q3 2024, the Netherlands lost around 4,000 self-employed healthcare workers, a 13% decline. The steepest fall was in elderly care, where the number of self-employed workers dropped by 63%.
Source: Statista, Statistics Netherlands, ING
Sick leave statistics in the Netherlands
In 2023, the average employee in the Netherlands took around 14 days of sick leave.
That's a slight increase on the COVID period, when employees took roughly 12 sick days a year. The rise matches growing concern about stress-related illness and mental health at work.
Work-related stress is now a major driver of sick leave in the Netherlands. An estimated 25% of all sick days taken by Dutch workers are put down to stress, the highest level since the middle of the COVID-19 pandemic.
Source: Gateway, I am Expat


